Intro to Monitors
What is a monitor
A monitor lets you run a collection periodically to check for its performance and response. You can set up a monitor to run as frequently as 5 minutes to check if all the requests in your collection are up and healthy.
When you set up a monitor, Postman servers will hit the endpoints in your collection according to the specified frequency. You can also select a corresponding environment to use and store variables. If you have written tests for your requests , the monitor would run these tests to validate the response and notify you when a test fails. You can configure how to receive the alerts from a wide number of integrations available.
Each Postman user gets 1,000 monitoring calls for free per month. Each Postman Pro and Enterprise team gets 10,000 free monthly requests, and it takes only 2 minutes to set up a monitor. Learn more about monitor pricing and getting started with monitors.
Running collections in a Monitor (vs. the Postman app collection runner)
There are a few minor differences between running collections in a Postman monitor as compared to using the Postman app collection runner. If your collection relies on any of these features, then it may not work the same way in Postman monitors that it does in the Postman app.
Variables
- Can’t import existing global variables, but you can create new ones during a monitor run.
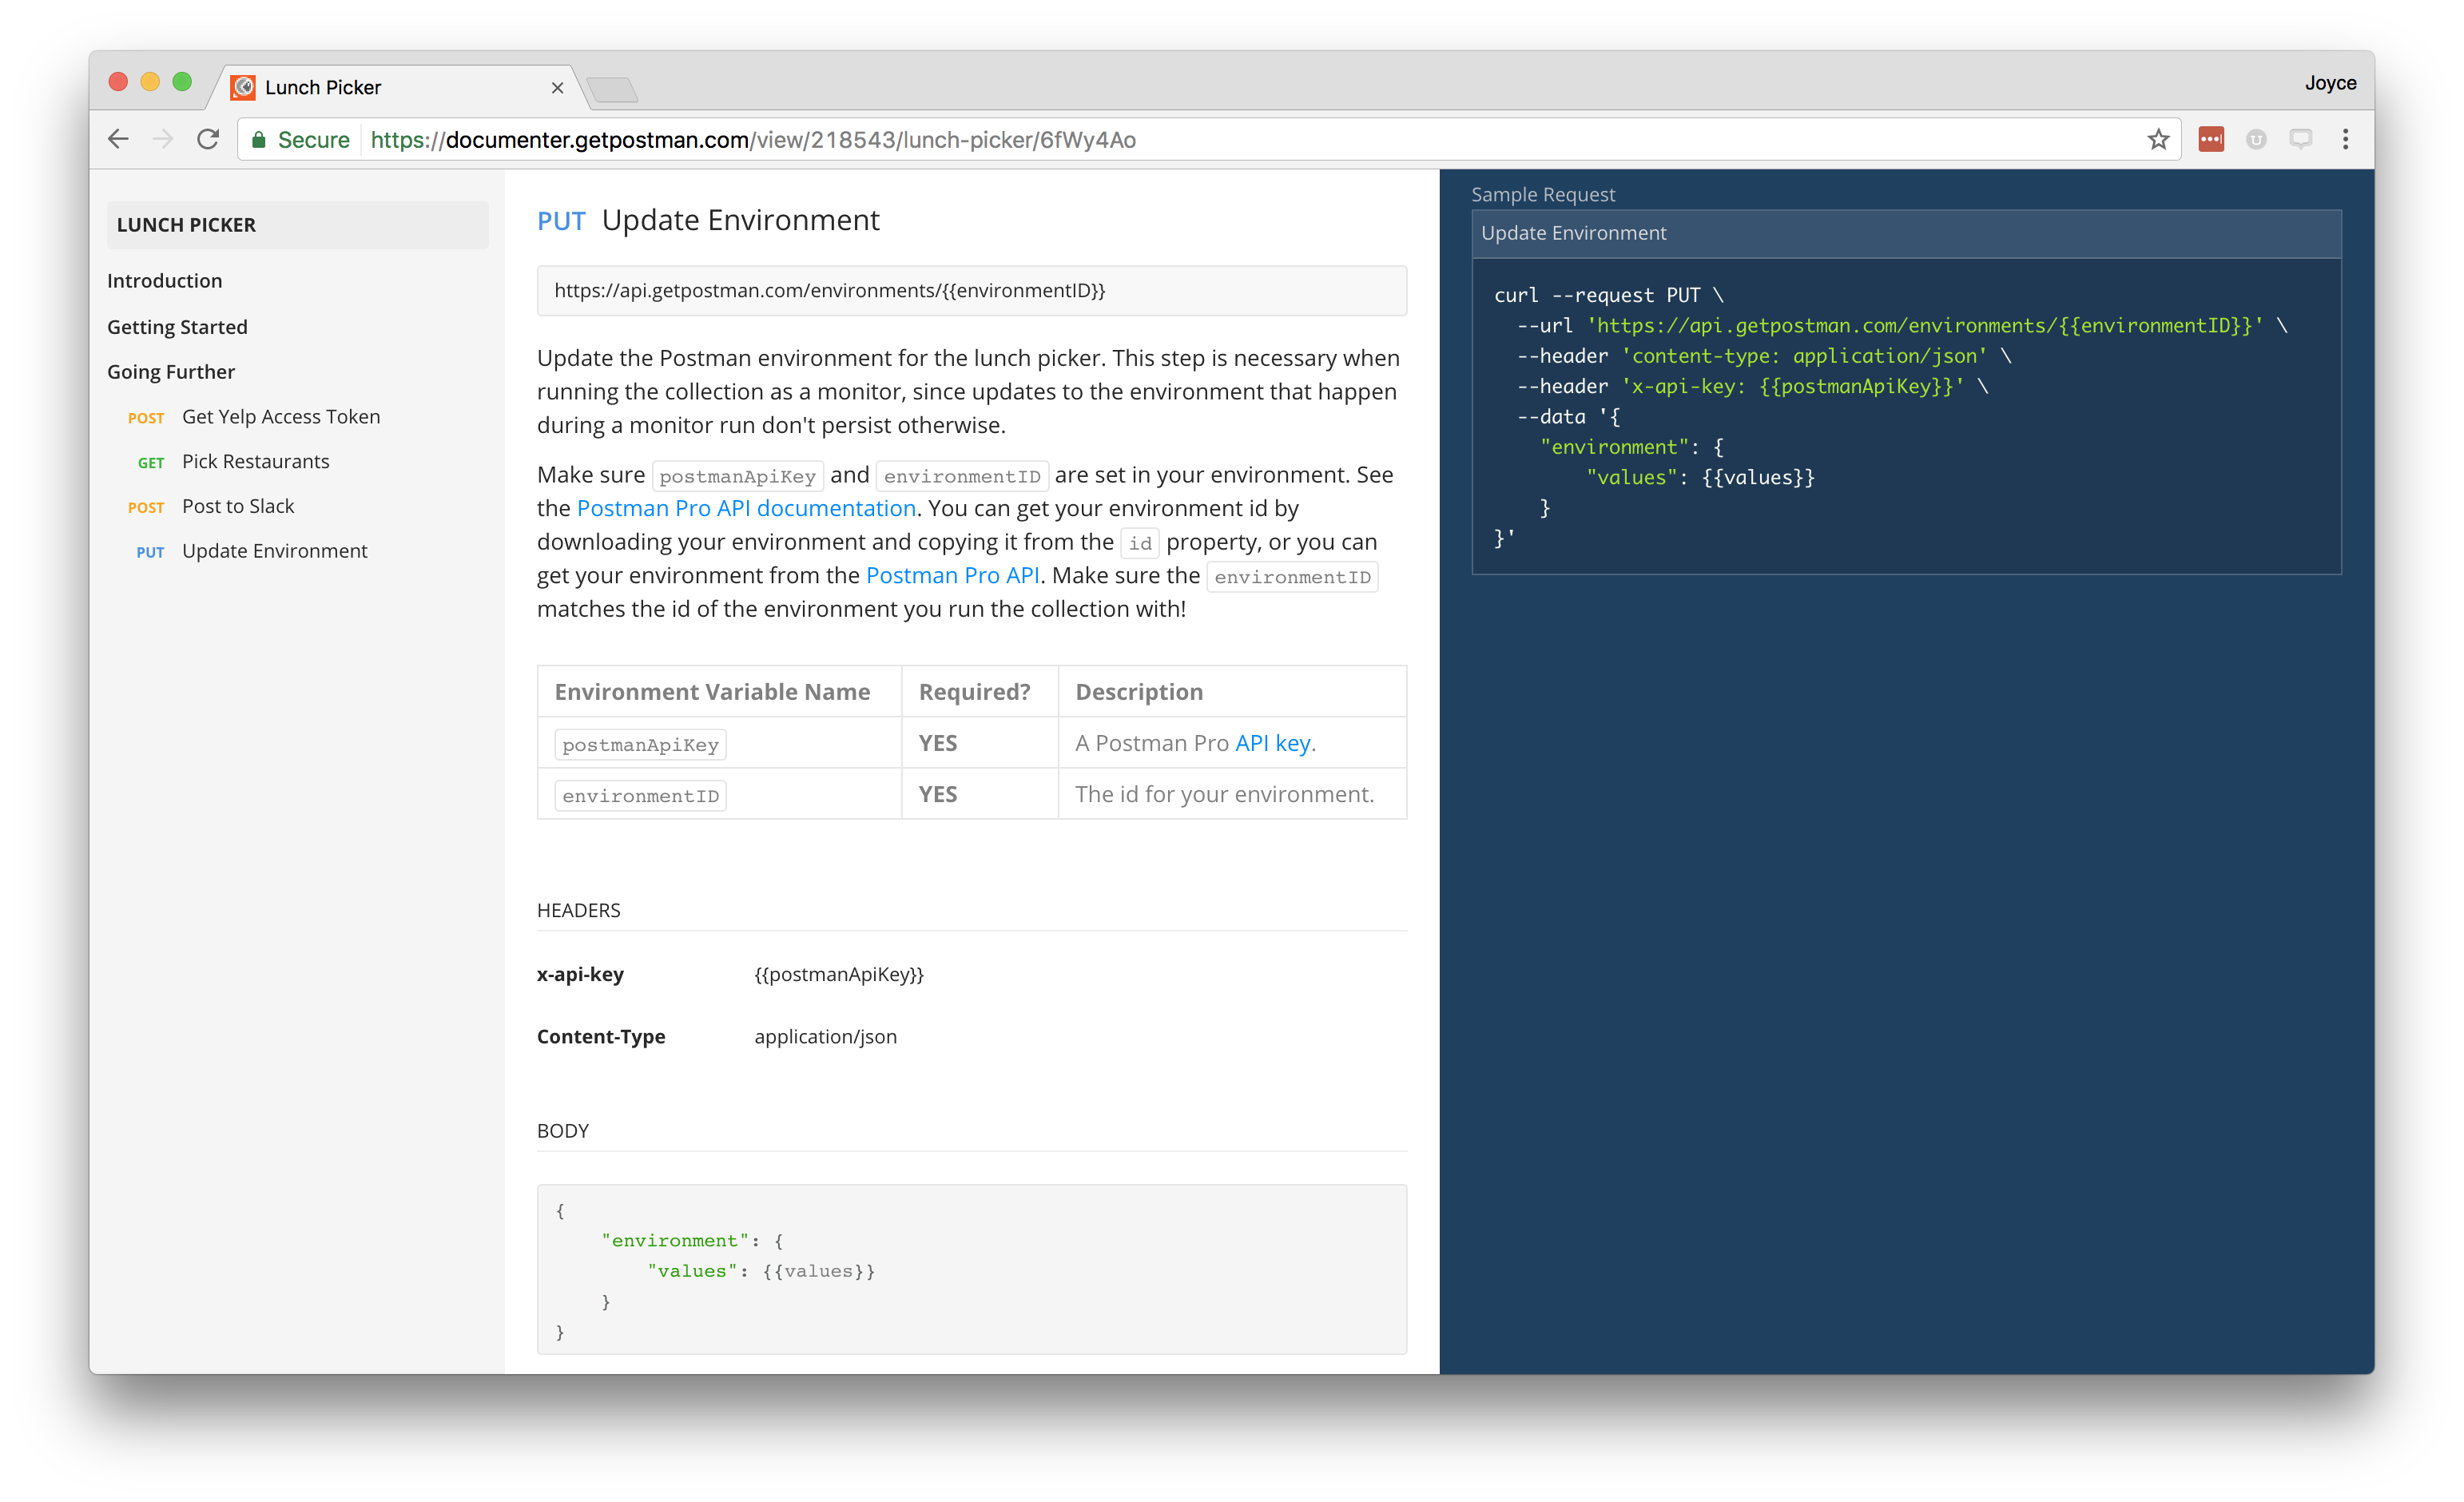
- Global and environment variables are not persisted. If you require persisting environment variables, we recommend adding a call to update the environment variable using the Postman Pro API. The following is an example of how to update the environment variable in this manner.
Console Output
- Unlike in the Postman app, request & response bodies are not logged to the console by default. This is for security and privacy reasons.
- Same goes for potentially-sensitive headers, such as cookies and auth keys
Time Limits
- Monitors can currently be scheduled to run as often as every 5 minutes, or as little as once a week. Each run is limited to 2 minutes, including all HTTP requests, responses, and pre-request and test scripts.
File Uploads
- Can’t attach files to requests, like you can in the request builder
- But you CAN upload data as raw request body
Multiple Iterations
- Monitors only run 1 iteration by default
- But you can use setNextRequest() to do multiple iterations
Multi-region Monitoring
- Monitors allow you to run collections in specified geographic regions
- Can only specify multi-region monitoring from the monitors page
Data Files
- Can’t attach data files like you can in the runner
- But you can access data files from APIs, such as Google Docs, Google Sheets, Dropbox, etc.
Accessible APIs
- As with the Postman app, the monitors require all URLs to be publicly-available on the Internet. In the future, you will be able to monitor private APIs as well.
- Monitors can’t directly access your localhost and might encounter a firewall because monitors run in the Postman cloud.
Monitoring resources in multiple regions
Monitoring resources across multiple regions provides useful information about the status and response time for your endpoints. If you’ve implemented a solution by setting up multiple servers running on multiple continents, then you want to make sure your endpoints are healthy and that none of your users are experiencing unusual delays.
Postman supports monitoring in 6 geographic regions around the world. If you’re interested in a region that’s not listed in the Postman interface, contact us at [email protected] or through the chat box on the monitors page.
Pricing for Monitors
Monitors are priced per request made, with some free requests included every month. Learn more about pricing for Monitors.
Free monitoring calls with your Postman account
Your Postman account gives you a limited number of free monitoring calls per month. You can check your usage limits through the Postman Pro API or the account usage page.
